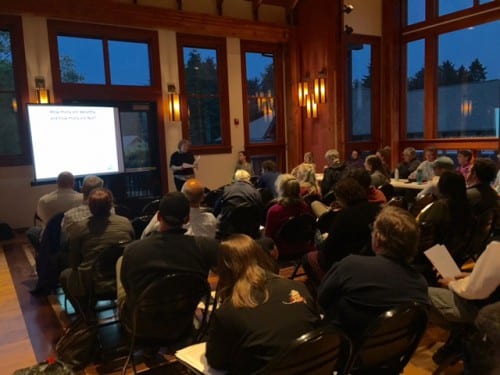
About thirty Sitkans attended a special meeting that outlined Sitka’s economy in numbers. Among the surprises? An income gap, non-resident workers, and an aging population. (Emily Kwong/KCAW photo)
The Sitka Planning Commission is re-writing the city’s Comprehensive Plan – a guide to future development in Sitka. And during a meeting on Tuesday night (09-08-16), the group got down to brass tacks about Sitka’s economy.
The presentation was led by Barbara Sheinberg, a planning consultant from Juneau hired on a $60,000 contract to assist the Sitka Planning Commission with gathering community input. Click here to see her full presentation and data gathered.
In a previous interview with KCAW, Sheinberg emphasized her focus on a “triple bottom line.” “Every decision that’s in front of you in a Comprehensive Plan, almost any kind of decision, you want to look at three things. You want to look at the economic implications of that decision. You want to look at the social and cultural implications of that decision. And you want to look at the physical or environmental implications of that decision. And then you look for the spot in the middle where they overlap – that sweet spot – and people call that triple bottom line thinking,” Sheinberg explained.
Tuesday’s presentation (09-06-16) focused on the economic side of the equation: How to bring money into Sitka and keep money in Sitka? To a crowd of roughly three dozen in the Del Shirley Room in Allen Hall, Sheinberg mined data from government agencies to reveal five surprising things about Sitka’s economy.
Surprise #1: Sitka’s workforce composition. Thirty five percent of local workers are not Sitka residents. Most of them are in manufacturing and seafood processing. Sheinberg wants to know: What can we do to get them to move to Sitka?

In 2014, one third of Sitka’s private sector workers were non-residents. The vast majority worked in manufacturing, particularly within the seafood industry. (Table courtesy of Barbara Sheinberg)
Surprise #2: Sitka’s income gap. Despite having the 4th highest per capita income in Alaska – at $61,204 – 20-30% of Sitkans are below the poverty level.
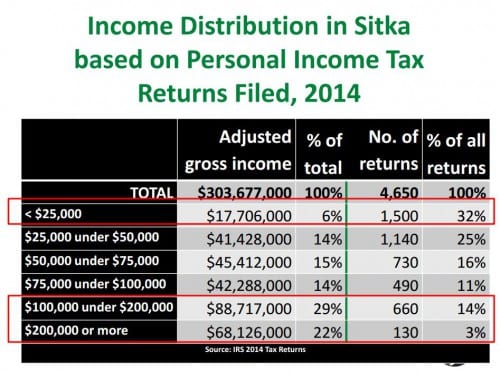
Based on federal income tax returns, Sheinberg determined that 57% of Sitkans are earning $50,000 or less in adjusted gross income. (Data courtesy of Barbara Sheinberg)
Sheinberg broke this disparity down even further. “57% of the tax filers in Sitka made $50,000 or less and 17% made $100,000 or more. And this is happening all over America. This is what you’ve read about. This is the end of the middle class. This is the disparity, you see it here,” she said.
Sheinberg connected this to affordability in Sitka. In 2014, the Alaska Department of Labor and Workforce Development projected that 25 people will leave Sitka every year over the next five years.
Surprise #3: The age of Sitkans over 65 will increase by 50% in the next ten years.
Surprise #4: A growing proportion of Sitka’s income is coming not from work, but from investments, rents, and retirement money.
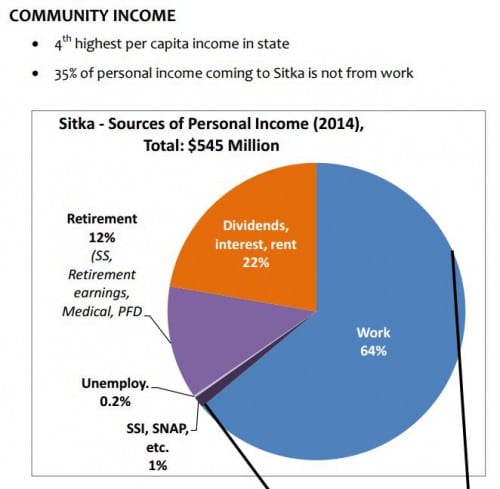
According to Garry White, director of the Southeast Economic Development Association, the proportion of community income generated through paid jobs has decreased – from 80% to 64% in the past 20 years. He interprets this as a sign that more retirees are moving into Sitka. (Chart courtesy of Barbara Sheinberg)
Sheinberg pointed to these data discoveries to ask another big question: Why are people leaving Sitka? Groceries and housing may only be part of the affordability picture. She pondered aloud, “Are you doing any exit interviews with people? Why are folks leaving? I mean, I would really be probing into that and setting a target. Why do people want to live in Sitka and what can we realistically influence? So that’s what I’d be looking at and hitting it hard in the next five years.”
Sheinberg’s presentation then pivoted to opportunities for economic growth in Sitka. She noted the prominence of “Blue Jobs” – a broad category that constitutes fishing, maritime tourism, the Coast Guard, and all jobs connected to the water. Blue Jobs make up one third of all jobs in Sitka and 40% of community income — which is not all that surprising.
Manufacturing, however, is.
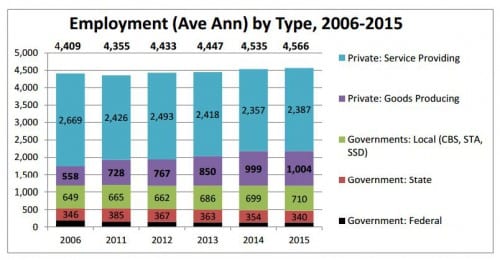
A rise in private, goods producing jobs is creating a “manufacturing cluster” in Sitka, says Sheinberg. (Table courtesy of Barbara Sheinberg)
Surprise #5: There is a growing number of private, goods-producing jobs. Those positions have doubled in the past decade. A municipality’s manufacturing is measured using an indicator called a “location quotient (LQ).” The United States is at a 1. Sitka is at a 4.
Sheinberg said, “[Sitka’s location quotient] is higher than the statewide. It’s higher than Petersburg’s. It’s higher than Wrangell’s. It’s higher than Ketchikan’s. You’ve got a lot of manufacturing jobs going on here. And this is my other most surprising thing. Is there any kind of a business forum that’s getting [these businesses] together to share information and be entrepreneurial and have ideas together? There’s something pretty interesting going on there.”
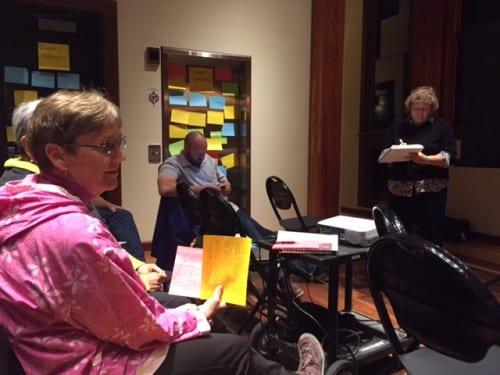
Planning Commission member Debra Pohlman and SEDA Director Garry White participate in a discussion about Sitka’s economic challenges and opportunities, while Sheinberg took notes. (Emily Kwong/KCAW photo)
At the end of her presentation, Sheinberg invited the group to identify major economic opportunities and challenges and post them on sticky notes around the room. These ideas were collected for future drafts of the Comprehensive Plan.
The next Comprehensive Planning meeting will be held at 7 p.m. October 5th at Harrigan Centennial Hall on the topic of housing. The commission aims to present a draft of the revised Comprehensive Plan to the Assembly next spring. For more information, visit the http://www.sitkacomprehensiveplan.com/.


